You're about to create your best presentation ever

Chalmers Master Thesis Presentation Template

Create your presentation by reusing one of our great community templates.

Master's Thesis Presentation - Chalmers

Transcript: Towards a Circular Use Phase Project Introduction What is circular economy? Circular Economy Research Questions RQ 1: What are the building blocks of circular use and what are the key characteristics of a circular automotive market offering? RQ 2: Based on the findings from RQ 1, what is a combination of market offerings that would be optimal from a circular economy perspective? RQ 3: How can existing automotive market offerings be evaluated and altered to reach higher levels of circularity by using the findings from RQ 1? Research Questions Methodology Methodology Single Case Study Volvo Car Group Data Collection 15 interviews: OEM employees Researchers Sustainability Consultants Complemented with data from documents Data Analysis Empirical Findings Based on an extensive literature review and 15 interviews the following findings have been identified. Empirical Findings The Building Blocks of Circular Use Circular Use Extend product lifespan Close the loop Increase the efficiency of use 1. Incentivize design for longevity 2. Inzentivize more extended use of cars 3. Incentivize careful use 4. Reduce unnecessary use 1. Minimize inactivity 2. Maximize filling rate during use 1. Incentivize design for closed loops 2. Incentivice returning the products Circular value Propositions Circular Value Propositions Circular Market Offerings Circular Market Offerings If manufacturer owns the car Carsharing Leasing Subscription Evaluation of Existing Offerings Application to Existing Offerings Conclusion Conclusion Definition and framework for circular use Evaluation of 3 existing offerings 4 circular market offerings

Presentation Master THesis

Transcript: Student: Gonzalo Genovart Urra Supervisor: Dr R A Tomlinson Repeat experiments using higher quality and resolution cameras. Not a very realistic option. Repeat experiments with more samples and same equipment. Higher resolution ultrasound in order to better compare the results. Improve painting techniques as paint introduced some noise in the signal. To better understand crack development in Glare validating results with Ultrasound scans. Aerospace Master Thesis Presentation Experiment 2 : Investigating Crack Growth rate on 0º fiber angle To investigate crack behavior in Glare Panels under cyclic loads using Thermoelastic Stress Analysis (TSA) Experiment 1: Effect of Frequency on thermal signal Loading was not large enough to start crack growth. Frequency range between 10-45Hz. Data collected at crack tip singularity and on strain gauge. Data collected several times and averaged. 25x zoom lenses used. Same stress ratio and rest of parameters. Glare What Thermoelastic Stress Analysis is. References [1] The specimen is painted in matt black to increase emissivity to almost 1. Hot-and-Cold plate calibration method to calibrate pixels on thermographer. Liquid Nitrogen used to increase Signal-to-noise ratio and sensitivity of thermal detector. Orthogonal strain gauges fitted on specimen. Calibration constant calculated previous to experiment. Investigating Fracture and Failure in Aircraft Wing skins Belongs to the fibre metallic laminate (FML) family of composites. Developed by TU Delft in the 1990 to substitute ARALL. Six different grades, This investigation used Glare 3-3/2 . Incredibly fatigue resistant , stiffer and lighter than monolithic Al. 3 layers of aluminium 2000 with 2 double glass fibre layers in between in a 0 ,90 orientation. Increasingly used in Aerospace Industry as a skin covering fuselages and wings. Ultrasound sublayer examination and comparison. TSA is a versatile and easy to use piece of equipment which offer much better resolution than other NDE techniques such as ultrasound scanning. In combination with TSA , FATCAT software is a powerful tool to analyse thermal data and relate this to the LEFM theory. Glare does not follow the Paris Law , " the higher the stress range at the tip the lower the crack growth" As loading Frequency increases the signal strength increases and phase difference decreases. Operation of New Large Aircraft Research. 2013. Operation of New Large Aircraft Research. [ONLINE] Available at: http://www.airporttech.tc.faa.gov/safety/bagot2.asp. [Accessed 10 May 2013]. Previous work on this field? [1] A 5mm radius semi-circular notch created on the specimen. 2 Glare Panels tested Stress Ratio of 0.4 , with a maximum stress of 190MPa 2 position zoom lenses with a resolution of 14.5px/mm FATCAT software used to analyse data. It was expected to have a crack with decreasing growth rate with cycles. Use TSA to monitor crack growth in different fibre orientations and comparison of results. Question Time. The Aim Experiment 3: Investigating Crack Growth Rate on 90º fiber angle Future work Effect discovered by Weber in 1830s. Similar cause to when heat is emitted in plastic deformation e.g metal rolling, friction within the material similar to hysteresis The intensity of this thermal energy production in elastic regime is lower than in plastic Thermoelastic effect is observed in all materials under cyclic loading conditions Temperature change in the order of thousandths of Kelvin. DeltaTherm 1410 (256x256px) by Stress Photonics, in combination with different thermal lenses Thermal maps are obtained, Thermal signal intensity is directly related to stress. Conclusions The crack is only present in the aluminium layers, not in the fibres Delamination length in the fibre-aluminium interface has a great effect on crack growth. Different TSA techniques have been used such as pulse heating to analyse effect of impact on composite materials. Cyclic loading frequency to be 10Hz or above to have a relatively adiabatic surface. Lock-in thermography can be used at any temperature, used at up to 1200K Experimental setup and Calibration The loading and frequency values were kept the same as in Experiment 2. Same exact notch at the same position as previous test.

Master Thesis Presentation

Transcript: Main Concerns Introduction Background Information Definitions Agenda Exposed to and target of abuse and discrimination Sunju Yoon 12/19/2014 FTWP is an ongoing issue in Canada Growing number of foreign workers Marginalized status Case study of Temporary Foreign Workers (TFWs) The citizenship boundary faced by foreign workers in South Korea and Canada Since the 1990s TFWPs started, the number of TFWs have rose dramatically groups of people who have set of rights without membership has appeared Access to rights is only available to individuals who hold membership in territorial boundary of citizenship Only possible to acquire through descent or by birth. Principles automatically exclude people whose membership are derived from a different territory Highly visible foreign group Raise knowledge and awareness of issues among FTWs and issues within countries & nations Eligibility? Who can access the rights in the same nation boundary? What makes the different status between resident foreigners and native citizens ? What are better ways to handle this situation? Therefore, I premise citizenship boundary should be re-drawn, reflecting a growing number of residential foreign nations and suggest stakeholder principle from Rainer Baubock as a qualification. He has also re-drawn the boundary of the states as a political community, but in this paper, I did not touch the boundary of political authority and just used the term as “a political community” followed by him. Labour shortage Solution: Import temporary foreign workers from Korea Introduction: Introduction: Why am I doing this work? Dramatic economic development in the 1980s Master Thesis Presentation Section 1:

Master Thesis Presentation

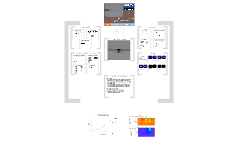
Transcript: Circuit Model Commutation Relations Matlab Capacitor WHAT WE DID : We derived a model for the time evolution of the two-level qubit eigenstates as a function of qubit eigenfrequency, temperature, qubit relaxation and coherence rates as well as input driving field. We calculated numerical graphs of the transmission and reflection showing results comparable to experimental observation, taking all approximations in consideration. WHAT NEEDS TO BE DONE : extend the model to a three-level system include other frequencies in the analysis explain the triangular structure Full Circuit Model Theoretical Model Derivation QUANTUM OPTICS Fundamental interaction between light and matter Fluoresence spectra : detect molecules, ... ARTIFICIAL ATOM Allows study of strong coupling regime Possibility of coupling atom to a single mode RELATED WORK O. Astafiev, A. M. Zagoskin, A. A. Abdumalikov Jr., Yu. A. Pashkin, T. Yamamoto, K. Inomata, Y. Nakamura, J. S. Tsai, "Resonance Fluoresence of a Single Artificial Atom," Science, Vol. 327, February 2010 A. A. Abdumalikov, Jr. , O. Astafiev, A. M. Zagoskin, Yu. A. Pashkin, Y. Nakamura, J. -S. Tsai, "Electromagnetically Induced Transparency on a Single Artificial Atom," PRL 104, May 2010 Triangular feature : numerical issue or physical ? Power conservation ? Lagrangian Conclusions and Outlook Legendre Transformation Introduction Cooper Pair Box Josephson Junction Full Circuit t_min = 0; t_max = 5e-7; tspan = linspace(t_min, t_max, 2500)'; sigma0 = [1 0 0 0]; options = odeset('AbsTol', 1e-30, 'RelTol', 1e-8); [T, sigma] = ode113(@diffsigma, tspan, sigma0, options); Heisenberg Eqs. of Motion Master Equation Results Hamiltonian Inductor Rewriting Output Field Up to 50% power lost ? --> contained in other frequencies Triangular structure still present in high precision plot ... Qubit energyspectrum Experimental Setup Perfect reflection in resonance at low incoming power Qubit = sharp frequency filter Filter width ~ 1 / relaxation time Perfect reflection in resonance at low incoming power Low amplitude = low incoming-photon rate If (incoming-photon rate << relaxation rate) --> perfect reflection Perfect reflection at -150 dBm No instant reflection because of blockwave shape of incoming voltage signal --> no single frequency 1D Waveguide

Master Thesis Presentation

Transcript: --> In-role behavior (IRB) for each relationship r:0.4 Literature review Job satisfaction Affective org. commitment Literature review identified antecedents build a social relationship with your employee - genuinely interested - social life - on the same level r:0.4 Extra-role western 3 job satisfaction Implication 1: Manager-subordinate relationship not on the same level 2 non-western pay-for-performance specifically --> focused on targets Implication 3: empowerment Job description of employees vs. Implication 2: service/sales 1 What is most important to a company? + However.... average r:0.3 Lack of consistency among studies Reason for further investigation: Meta-analysis study Customer satisfaction 85 studies --> individual 15 relationships Leader-member exchange Results r:0.1 "a job is synonymous with a role" Procedural justice Future research on organizational performance e.g. sales targets, production output Analysis Implication 2: service/sales by S.U. Peters Consequence: Customer satisfaction did not lead an groundbreaking result 3 important implications Recap + Future research Extra-role behavior internal processes Moderators How to influence these behaviors? Job satisfaction ERB is defined as behavior that is beneficial to the organization, goes beyond formal job description and is often voluntary (e.g. extra hours, altruistic behavior, and donating) job satisfaction Example: Psychological empowerment correction for measurement error ? 01/07/2015 Supervisors: dr. J.J.L. Schepers dr. ir. W. van der Borgh r:0.1 "Everyone talks about building a relationship with your customer. I think you build one with your employees first." Angela Arhendts (vice president Apple) Meta-analysis Customer satisfaction (CS) Affective organizational commitment Job satisfaction Affective org. commitment How to measure your employees performance? r:0.4 However, not everything can be put into prescribed roles --> extra-role behavior (ERB) In-role Meta-analysis on the antecedents and consequences of in-role and extra-role behavior in-role behavior physically further away from the company in-role behavior Job satisfaction (JS) Affective organizational commitment (AOC) Leader-member exchange (LMX) Perceived organizational support (POS) Psychological empowerment (PE) Procedural justice (PJ) Perceived organizational support Implication 1: Manager-subordinate relationship performance r:0.4 Where should a manager pay attention to? in-role behavior In-role behavior job satisfaction In-role behavior & extra-role behavior Extra-role behavior Extra-role behavior is defined as behavior that is beneficial to the organization, goes beyond formal job description and is often voluntary (e.g. extra hours, altruistic behavior, and donating) In-role behavior + Extra-role behavior pay-for-performance no pay-for-performance non-service/sales context moderators? job satisfaction in-role behavior social aspect of relationship subordinate rate lower 0.3 Range arrange weekly timeslots for employees to meet and brainstorm about non-In-role behavior related topics work aspect of relationship manager rate higher service/sales context rating manager vs. subordinate In-role/extra-role behavior each represents a correlation (r) ranging from 0 to 1 service/sales vs. non-service/sales rating manager vs. subordinate Leader-member exchange In-role behavior is regarded as the behavior required by formal job descriptions In-role behavior however, don't take it to far! western studies vs. non-western studies

Master thesis presentation

Transcript: Directive 2008/101/EC - The Aviation Directive Included Aviation activities in EU ETS Came into force 1st of January, 2012 Attributed aviation emissions Economic analysis of Directive 2008/101/EC The Coase Theorem The market should deal with externalities by bargaining over allocation of resources at no cost Bargaining = Transaction cost Tragedy of the Commons How should pollution be solved? Internalize the externality Give someone the right to pollute Command and Control Principle Brief introduction of global warming; causes and effects Brief indroduction of international agreements on climate change Economic analysis of law; theoretical approach Kyoto Protocol cont. In 1995 parties of the UNFCCC wanted more effective solution Kyoto Protocol was adopted in 1997 Came into force in 2005 Is linked to the UNFCCC Sets binding emission reduction targets on its parties Kyoto Protocol Academic Supervisors: Ellen Margrethe Basse, Department of Law Jan Bentzen, Department of Economics 195 countries have ratified the Convention Parties are divided into three groups: Annex 1 parties Annex 2 parties Non-Annex 1 parties Economic analysis of law Used to predict how people react to law Used to predict who really bears the burden of taxes Used to predict distributive consequences of policies Three enterprises of law and economics Positive economics Descriptive economics Normative economics Greenhouse Gases International Opposition to EU ETS Aim of the Thesis UNFCCC was adopted at the Rio Earth Summit in 1992 Came into force in March 1994 The objective is stabilization of GHG emissions to limit average global temperature increases and climate change Economic Analysis of inclusion of Aviation activities in the EU ETS: EU v.s. Non-EU airlines, a competitive approach Climate Change United Nations Convention on Climate Change To assess the economic impact of inclucion of aviation activities to EU´s ETS To assess how two different set ups of the ETS can affect competition between EU- and non-EU airlines To emphasize the importance of economic analysis of law EU ETS Today´s agenda Three markets were analyzed Flights between two non EU countries where no direct flights are available Flights between an EU hub and non EU hub where no direct flights are availableTravel within the EU Limitations of law and economics Parties of the UNFCCC UNFCCC and EU EU policy makers turned the attention to aviation in 2005 CO2 emissions from aviation had increased by 90,3% in 20 years, between 1990-2010 Student: Bergur G. Jónasson Line of study: MSc EU Business and law Carbon dioxide (CO2) Nitrous oxide Methane, Ozone and chloro-fluorocarbons Law and Economics Directive 2003/87/EC - The ETS Directive Launched in 2005 Key tool of the EU to reach their commitments under the Kyoto Protocol Divided into three phases: 2005-2008 2008-2012 2013-2020 Many legal scholars find the economic approach hard to accept The reason might be the language of modern economics Mathematics the language of economics Economics vs. value jugdements Beliefs, views, ideas and opinions Assumptions of human endeavour Parties: 191 States 1 regional economic integration organization Mechanism: International Emission Trading Clean Development Mechanism Joint Implementation Inclusion of Aviation in EU ETS EU Emission Trading System (ETS) In 1993 the EU joined the UNFCCC after Council´s approval with Decision 94/96/EC In 2002 the EU ratified the Kyoto Protocol with Decision 2002/358/EC EU member states are allowed to fulfill commitments under article 3 of the Kyoto Protocol jointly, acting as a regional economic integration organization Law and economics Law and Economics The international aspect has faced huge opposition Nations such as USA, China, Russia and India Case 366/10/EC International part of ETS put on ice, memo 12/854/EC Solution in sight at ICAO level ICAO assembly, September 2013 Economic Analysis of inclusion of Aviation activities in the EU ETS: EU v.s. Non-EU airlines, a competitive approach How emissions of GHG affect Climate Change The Coase Theorem The market should deal with externalities by bargaining over allocation of resources at no cost Bargaining = Transaction cost Tragedy of the Commons How should pollution be dealt with? Aim of the Thesis Master thesis defense 10th of June 2013, Aarhus, Denmark

Master thesis Presentation

Transcript: Demand Side management Potential In Swedish Residential Households How much wind can be integrated with load shift? 0.6kWh reduction in Peak hour Electricity Prices Methodology flowchart Water heating Aim Special thanks to Mikael, Emil & Erika What happens when every one starts optimizing their bills? Savings from shift around 800 SEK/yr with load reduction of 540 kWh/yr Recent developments Data collection Results - Effect on system load 0.4 kWh reduction in Peak hour DSM+spot market Results - Savings and Potential Losses equivalent to 30W Equivalent to 1% of heating capacity No significant difference in couple w/o children households Aim Savings from systems level have to be considered Results-Savings and potential The economic incentives are small Background Future Work 3 family SFD were chosen Assumptions: -100L water tank -3kW heater -Minimum temp. 55 degrees -Max temp 85 degrees Effect of marginal cost of electricity What are various manageable loads? Future Work Classification of archetype buildings What is the potential to shift? Space heating Classification of archetype Physical Measures Low savings achieved - best case was 45 SEk/yr How much savings can be achieved? Master Thesis Presentation Discussions Methodology Methodology Thank You All!! Presentation outline Famlily house- Direct heating Important to consider price rise in off peak Influence on System load curve Dishwasher+Laundry National Planning target - 30 TWh from wind by 2020 12 GW wind installation Possibility of paying electricity bill on hourly basis Use of heating even when outside temperature is high!!- High potential for energy savings 126 TWh electricity consumption in Sweden Results - Load shift in individual household level Made my Emil and modified by me! Significant shifting potential exists Space heating methodology needs more development Peak load reduction between 1.1% to 2.3% (300MWh) achieved due behavioral measure load shift Behavioral Measures Foundation GAMS-Model Results and discussions Conclusion Famlily house- w/o direct heating Valley filling for Behavioral measures Load data is crucial for planning electricity distribution networks and optimal production capacity. Used method indicates lower potential to shift for Space heating 0.7 kWh Increase during Off-peak Peak load reduction between 3,5% to 5% (700-950 MWh) achieved due to water heating load shift Load reduction & Savings from unwanted heating during summer 0.8kWh Increase during Off-peak Lower savings in Sweden due to High Hydro in system Conclusion 1 house- high consumption, other 2 lying in average consumption category Model assumes instant temperature drop or increase in load shifting - Not true Results - Effect on system load curve Background Smart technology needed for valley filling Improving methodology for space heating & finding the potential to shift Sanket Puranik, MPSES Price based model Input=load curve of individual load of a house Constraints = different for different measures Output= Shifted load curve giving minimum cost Swedish Energy Agency Campaign- 400 Houses Nordpool Spot SCB Actual potential for increase? - survey of people's willingness

Now you can make any subject more engaging and memorable