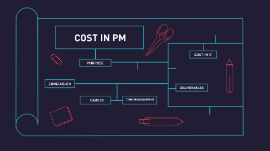
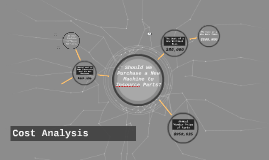
You're about to create your best presentation ever

Cost Analysis Template Powerpoint

Create your presentation by reusing a template from our community or transition your PowerPoint deck into a visually compelling Prezi presentation.

Cost Analysis

Transcript: Cost Analysis for Care Management Managerial Accounting Evaluate the Primary Care office for Care Management Purpose Purpose Healthy Bottom Line Cannot be losing money Financial Health Financial Health Medicare and Medicaid Priority Health Blue Cross Blue Shield of Michigan 65 years + Multiple Chronic Conditions Population Population Background Background Why Care Management? Rising Cost Rising Cost Annual US Expenditures on Healthcare Trillions 1995 2007 2017 2020 2017 near 3.5 Trillion 3 1 2 4 Reduce cost Improve quality Improve experience Payers Payers Medicare and Medicaid Accountable Care Organizations Hospitals Primary Care Offices Specialists Nursing Homes Ancillary Services Medicare and Medicaid There are 44 Accountable Care Organizations (ACO) around the country. There are 3 ACOs in Michigan Priority Health BCBSM Priority Health BCBSM Primary Care Offices Infrastructure Payments 3% of insured population Evaluation Evaluation Payer Mix 50% of payers offer value based contracts Payer Mix Cost Analysis Priority Health................................. $ BCBSM............................................... $ Billed Encounters........................... $ Increased RVUs............................... $ Total Revenue............................... $ Annual Salary...................................$ Benefits.............................................$ Office Supplies...................................$ Billing Infrastructure..........................$ Total Cost........................................$ Net Increase......................................$ Cost Analysis Recommendation to approve additional FTE for Care Management Conclusion The cost analysis allows management to show that adding a care manager FTE will not place an undue financial burden on the practice. Additionally, provides specific data showing the potential revenue for the practice. The cost analysis allows us to be good stewards of the resources available. Conclusion

Cost Analysis

Transcript: equation for estimation of cost for various capacity of HE Prediction of the total project cost Involve in developing an approximation costs of the resources needed to complete project activities Project Background Country of Origin *Fixed Tube Heat Exchanger Data Extraction & Analysis POs: Fired Heaters General Objective: To provide cost estimation for future reference to PETRONAS Detail Information is gather from UIO Package Bid Evaluation Regression Analysis Plate-Fin HE ACCE/ Kbase simulation Equipment & Setting Shell & Tube HE Purpose of cost Estimating Reliable Estimation Term & Condition Differences ? Cost Estimation Inconsistency of the results is due to several factors which are Planning & Scheduling The data is stimulated in ACCE software used as a guidance to make a decision faster with less uncertainty by providing more exact and detail cost of forecasts Equipment Installed Cost Project Budgeting Control Student Industrial Project (SIP) Budgeting Estimate Better predictability Initial Estimate KBase/ACCE: Cost Estimating Determination of the project Overall Cost Control for future reference as historical relationship is dependable used to produce initial equipment design and complete EPC approximations by stimulating the vendor-costing prices Cost Benefit Analysis for Shell and Tube Heat Exchangers based on UIO RAPID Project. Data Analysis Problem Statement Start Works by transmitting heat from one fluid to another Primavera Software - updated price based on online system Cost Control Instrumentation Project Funding Agitated Vessel Structural Steel Double Pipe HE Conclusion End Progress Schedule Project Control Specific Objective: To practice data analysis by using KBase/ACCE software To differentiate the driving cost for shell and tube heat exchanger To analyze the cost curve from the data base extraction Development of Cost Estimating Piping give higher percentage compared to to the others. This shows that piping give greater contribution in price of equipment especially in HE. Direct Contact Variance Analysis Invoicing Process TYPE OF HE *U-tube Market Demand Stage of Estimation Civil Data Analysis y = 1133.7x + 59553 R² = 0.8019 Air Cooled ACCE Better cost control May 2016-August 2016 HC Supervisor : Puan Zaiton Ismail UTP Supervisor: ASSOC PROF DR MARAPPAGOUNDER RAMASAMY 1) Natural Gas Heater Presentation Outline separated by a solid wall to prevent mixing Question & Answer Piping Process equipment is choose in (iPceD) Quotation Estimate Baseline Schedule Heat Exchanger Spiral HE Plate HE Project Feasibility Recommendation categorized decomposition of the range that needs to be predictable and implemented during the course of the project for future review Usage of graph widely used in space heating, refrigeration, air conditioning, power stations, chemical plants, petrochemical plants, petroleum refineries, natural-gas processing, and sewage treatment Difference ? *Floating Head Cost consume by construction exceed the budget and do not follow the time frame. This project addresses the method of estimating the cost of equipment by using effective cost database Data Information must be complete - Point of origin 2) LPG Superheater - Methodology 3) LPG Vaporizer y = 964.79x +12142 R² = 0.9744 Estimation 4) Excess LPG Vaporizer Design Pressure Term & Condition Future Expansion Project Background Objectives Methodology Data Analysis & Results Conclusion Future Expansion Q & A Paint Higher regression value gives more reliable data relationship Insulation Presenter: Azreen Binti Zulkhairi (20083) ACCE design parameter mostly based on default settings Findings Summary of WBS Compare the ACCE price and POs Analyze the cost differences The relationship can be established using excel spreadsheet with optional various type of graph. Shell & Tube HE Firm Bid Price Objectives Benefits of good cost estimate for the project WBS Electrical

Cost Analysis

Transcript: COST IN PM PURPOSE Cost analysis is the most important thing to define after a project has been proved feasible Description Cost estimating is the practice of forecasting the cost of completing a project with a defined scope. It is the primary element of project cost management, a knowledge area that involves planning, monitoring, and controlling a project’s monetary costs. The approximate total project cost, called the cost estimate, is used to authorize a project’s budget and manage its costs. Types Cost in a Project can be divided into direct cost and indirect cost. They both affect the project in different ways and need to be considered thoroughly before proceeding with the project Direct costs: Examples of direct costs include fixed labor, materials, and equipment. Indirect costs: Examples of indirect costs include utilities and quality control. Incurred by the organization at large, indirect costs occur at the same time as the project, but are not necessarily caused by it. Next, the project manager will need to undertake the process of cost estimation, which is used to predict the resources needed to complete a project within a defined scope, and determine whether the project will be greenlighted. COST IN IT Redesign costs Coding architecture needs to be as general and decoupled from any technologies implemented. Future updates in outside technologies may cripple the current implementation, and thus create an increase in cost due to redesign hours Poor Planning When a project has a variable that is not considered it may affect the project in a way that it may be catastrophic, forecast and deep analysis must be done in order to achieve a great outcome Downtime Downtime may affect the projects earnings and time. So if you're dependent on outside technologies you need to have a backup plan for the given event these technologies have downtime COST PLANNING Cost in IT may be different due to the nature of the LOB. However, it still needs to be considered and a proper forecast has to be made to avoid unnecessary iterations that will increase the cost. DELIVERABLES Although not many people like it. Deliverables and documentation are extremely important to save time when analyzing software, code, APIs, etc. TIME MANAGEMENT PLANNING DESIGN IMPLEMENTATION RELEASE Any of these iterations needs to be planned to avoid re-iterations. However, there are some design patterns that require re-iterations Time management is really important in IT. The cost may increase significantly if not managed appropriately. SCRUM Trello, Monday, Agile CAUSES INACCURATE PROJECT COST ESTIMATES THE MOST LIKELY CAUSES OF INACCURATE PROJECT COST ESTIMATES Lack of experience Human resources Length of planning OTHER COMMON MISTAKES Not fully understanding the work involved in completing work packages: This is sometimes a problem for inexperienced project teams who have not worked on similar projects before. Expecting that resources will work at maximum productivity: A more appropriate rule of thumb is to assume 80% productivity. Dividing tasks between multiple resources: Having more than one resource working on a task typically necessitates additional planning and management time, but this extra time is sometimes not taken into account. Failing to identify risks and to prepare adequate contingency plans and reserves: Negative risks can both raise costs and extend durations. Not updating cost estimates after project scope changes: Updated cost estimates are an integral part of scope change management procedures, as project scope changes render prior estimates useless. Creating hasty, inaccurate estimates because of stakeholder pressure: Since project managers are held accountable for estimates, order of magnitude estimates are a much better choice than numbers pulled out of thin air. Stating estimates as fixed sums, rather than ranges: Point estimates are misleading. All estimates have inherent degrees of uncertainty, and it is important to adequately communicate these via estimate ranges. Making a project fit a fixed budget amount: The scope of a project should determine its budget, not the other way around. Other Common mistakes CONCLUSION The usefulness of a cost estimate depends on how well it performs in areas like reliability and precision. There are several characteristics for judging cost estimate quality. GOOD COST ESTIMATES Accuracy: A cost estimate is only as useful as it is accurate. Aside from selecting the most accurate estimating techniques available, accuracy can be improved by revising estimates as the project is detailed and by building allowances into the estimate for resource downtime, project assessment and course correction, and contingencies. Documentation: Since project managers are eventually held accountable to cost estimates, it is important that the assumptions underlying estimates are identified and recorded in writing, and that regular budget statements are provided. Thorough documentation precludes

Cost Analysis

Transcript: II- RO System System output Energy one m³ of water 0.24 LE per m3 0.50 LE per m3 Summary of chosen PV system components The energy requirement is 1.22*10^6 kwh/year (3.5kwh/m^3* 960m^3* 365 days ) Labor and administration Assuming the degradation factor is 2% The capital cost of PV system = 1,074,000 $ the capital cost of the system is 585,000 $ And from the government is 15 EGP/m3 The Running cost Where i is the interest rate = 1.5% ; g is the degradation factor = -2% ; N is the life span = 25years. Chemical requirements I- For PV system #The civil work is estimated as 0.274 LE/ m3 0.52 LE per m3 The energy generated for the first year is equal 1.98 MWh 0.274 LE/m3 * 960m3/day * 365 day/year *25 year = 2400240 LE = 342891 $ • The initial cost of the system (the capital cost) is high. RO system ~ 63000 $ / year = 3.6 EGP/ m^3 power consumption = 3.5 kwh/m³ The aim of this analysis is to calculate the life cycle cost of : with Array size = E/(days*kwh/day*ή) The costs of a stand-alone PV system include : • Replacement costs are low (mainly for batteries). # PV cost = 1074000 $ #RO system = 585,000 $ Total capital cost = 2,001,891 $ ~ 2 M$ For the first year P1=1.98 *10^6 C1 C1= cost per kwh running and maintenance costs. Total cost= 4.85 M$ stand alone PV sys The cost from the desalination plants =8 EGP/m3 The Total Capital Cost Maintenance and repair Thank you :) The major factors that influence the cost are the Economic Analysis P1=0.29 M$ C1\P1=0.29/1.98= 0.146 $/kwh Cost per m^3 = (Total power consumption = 3.5 kwh/m3)* (cost per kwh ) = 3.5 * 0.146 = 0.513 $/m^3

Now you can make any subject more engaging and memorable