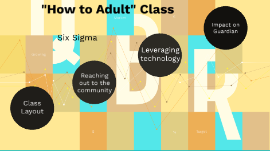
Six Sigma Presentation
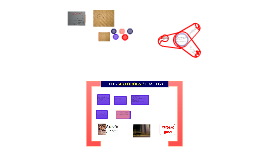
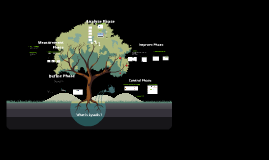
Transcript: Six Sigma "How to Adult" Class Class Layout Layout of the class Location and frequency Method of presentation Interactive/fun element with prize Credit Card (How To Use, How To Apply, Credit Score, Paying Off Debt) Student Loans (How To Create, How To Budget, Money Allocation) Personal Budgeting (Savings Vs Checkings) Investing and Saving for the Future (Different Interest Rate Types, Benefits Of Compound Interest, Retirement, 401K, Pensions) Insurance (FAQs, Life, Renters, Disability) Topics Topic Frequency/Location Location/frequency Once a month every month, each month is a new topic Location will be Skype, people can join from anywhere, link to meeting will be sent to email. Presenter will have video on to make the presentation more engaging Logistics Presenting Logistics One topic per class, each topic will have sub topics. At the end of each sub topic, there will be questions. Participants earn points for answering the questions quickly and correctly. At the end of the class, there will be a short game and the person with the most points from the questions + game will win a small prize Interactive Interactive element 2 questions per sub topic, Kahoot format; the faster the participants give the correct answer, the more points they get. At the end there will be a slightly bigger game (maybe mini Jeopardy or something). At the end, the person with the most points will be getting a small prize (you can send Visa gift cards through email, $10 minimum, as an example) Where we stand Reaching out to the community Wins Wins Initiatives Initiatives Top performers Top performers New business New business Current standings Current standings 43,4% Q3 vs Q4 10,2% YoY Quarterly Sales Summary Quarterly Sales Summary 15% 37% 9% 2% Losses Losses Failed initiatives Failed initiatives Lost businesses Lost businesses Missed Opportunities Missed Opportunities Takeaways Takeaways Closing the gap Leveraging technology Proposal Proposal Initiative 1 Initiative 1 Initiative 2 Initiative 2 Initiative 3 Initiative 3 Risks Risks Risk 1 Risk 1 Risk 2 Risk 2 Risk 3 Risk 3 Risk management Risk management Benefits Benefits Benefit 1 Benefit 1 Benefit 2 Benefit 2 Benefit 3 Benefit 3 The forecast The forecast The sales funnel The sales funnel Projections Projections What does Guardian gain from this? Impact on Guardian Name Recognition: Name Recognition This will allow us to flaunt our amazing company culture to the outside world. When people think of Guardian as a result of this program, they will think of a philanthropic company that helps out local communities. Future Potential Employees Resources The program will spark an interest for a Guardian career in all the students that are reached by the program. Many students don't know about the different opportunities that exist at Guardian, and this will increase awareness. Employees would love to volunteer to teach high school students Employee Relations